 |
2000 Election |
 |
 |
2000 Election |
 |
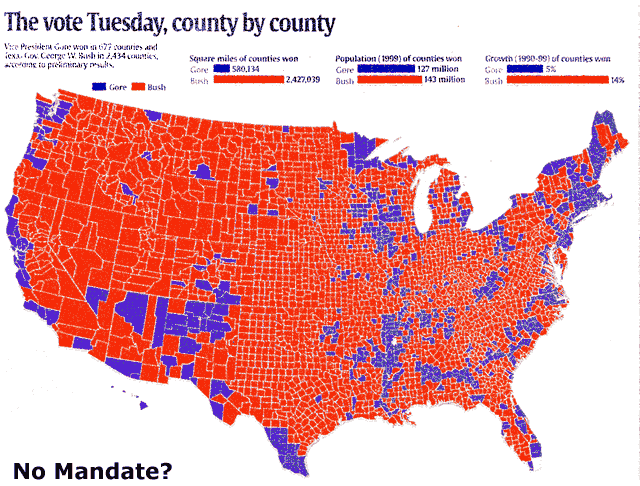
 This map was printed in USA Today newspaper seven days after the election. The RED
area is for George W Bush, the BLUE is for Al Gore. This is why we need to keep
the Electoral College.
Who REALLY won the popular vote?
| Al Gore | George Bush | |
|---|---|---|
| Number of Counties Won | 677 | 2,434 |
| Square Miles Won | 580,134 | 2,427,039 |
| Population(1999) of Counties Won | 127,000,000 | 143,000,000 |
| Growth(1990-1999) of Counties Won | 5% | 14% |